Are you trying to decide which WordPress debug plugin is best for debugging and troubleshooting errors on your WordPress site?
Let’s face it – debugging WordPress errors can be a real hassle without the right tools. You end up spending hours of your valuable time guessing and trying to find the root cause, sometimes to no avail. The worst part is that bugs and errors significantly impact the overall user experience on a website. So, resolving them as quickly as possible is crucial for business.
This is where WordPress debug plugins come in. They make the process of detecting and troubleshooting errors on WordPress sites much faster and easier.
There are several WordPress debug plugins available, and in this article, we compare and highlight the best options so you can choose the right one for your needs.
Table of Contents
- What is a WordPress Debug Plugin
- 7 Best WordPress Debug Plugins
- Best WordPress Debug Plugins — Conclusion
What is a WordPress Debug Plugin
A WordPress debug plugin is a tool that makes troubleshooting easier. It offers a user-friendly interface to enable WordPress’s built-in debugging features and other advanced options.
Without a WordPress debug plugin, you would typically have to turn on WordPress debug mode by manually adding WP_DEBUG code to your site’s wp-config.php file. You’d then have to locate and review the debug.log file, which displays logged errors within a text editor. This process can be pretty slow and inefficient, especially if you are working on multiple sites with limited time.
WordPress debug plugins eliminate the need for this manual step, with many offering valuable debugging features such as:
- A centralized view of all logged errors from the WordPress admin dashboard.
- Search and filtering capabilities for sorting through log entries by type, keyword, time, and more, saving you time.
- Real-time logging of PHP errors, warnings, notices, and deprecation messages.
- Insights into other site details you may need to analyze and debug, including HTTP API calls, hooks and actions, database queries, memory usage, etc.
- Performance and query monitoring to identify and fix queries that might be slowing your site down.
- Bulk disabling plugins and themes if your site crashes or you get locked out.
- Email alerts to notify you of critical errors on your site, and much more.
In essence, WordPress debugging plugins are a huge time-saver for developers and are also perfect for users with limited technical expertise.
7 Best WordPress Debug Plugins
Now that you understand what a WordPress debug plugin is and the features to look out for, let’s review our list of the six best WordPress debug plugins!
For each plugin, we provide an overview, key features, and pros and cons to help you make an informed choice.
1. WP Debug Toolkit
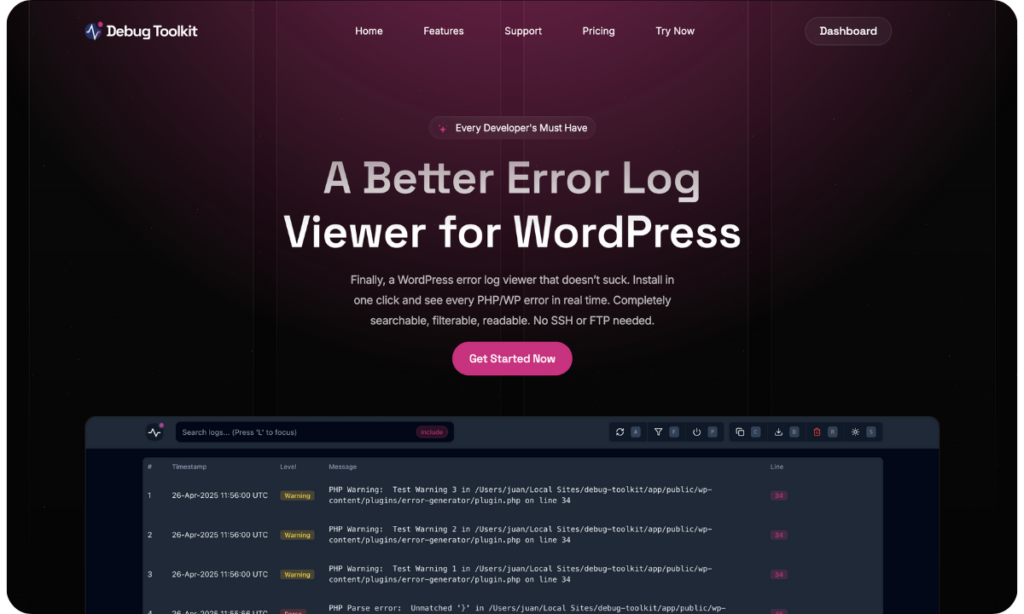
WP Debug Toolkit is a premium debugging plugin that simplifies the management of debug constants by allowing users to activate debug mode directly from the admin dashboard with a single click.
Unlike other debug plugins that stop working when your site goes down, WP Debug Toolkit includes a standalone log viewer app that keeps running even if WordPress completely crashes. This game-changing feature means you can always see what went wrong and get your site back online faster without needing FTP access or technical workarounds.
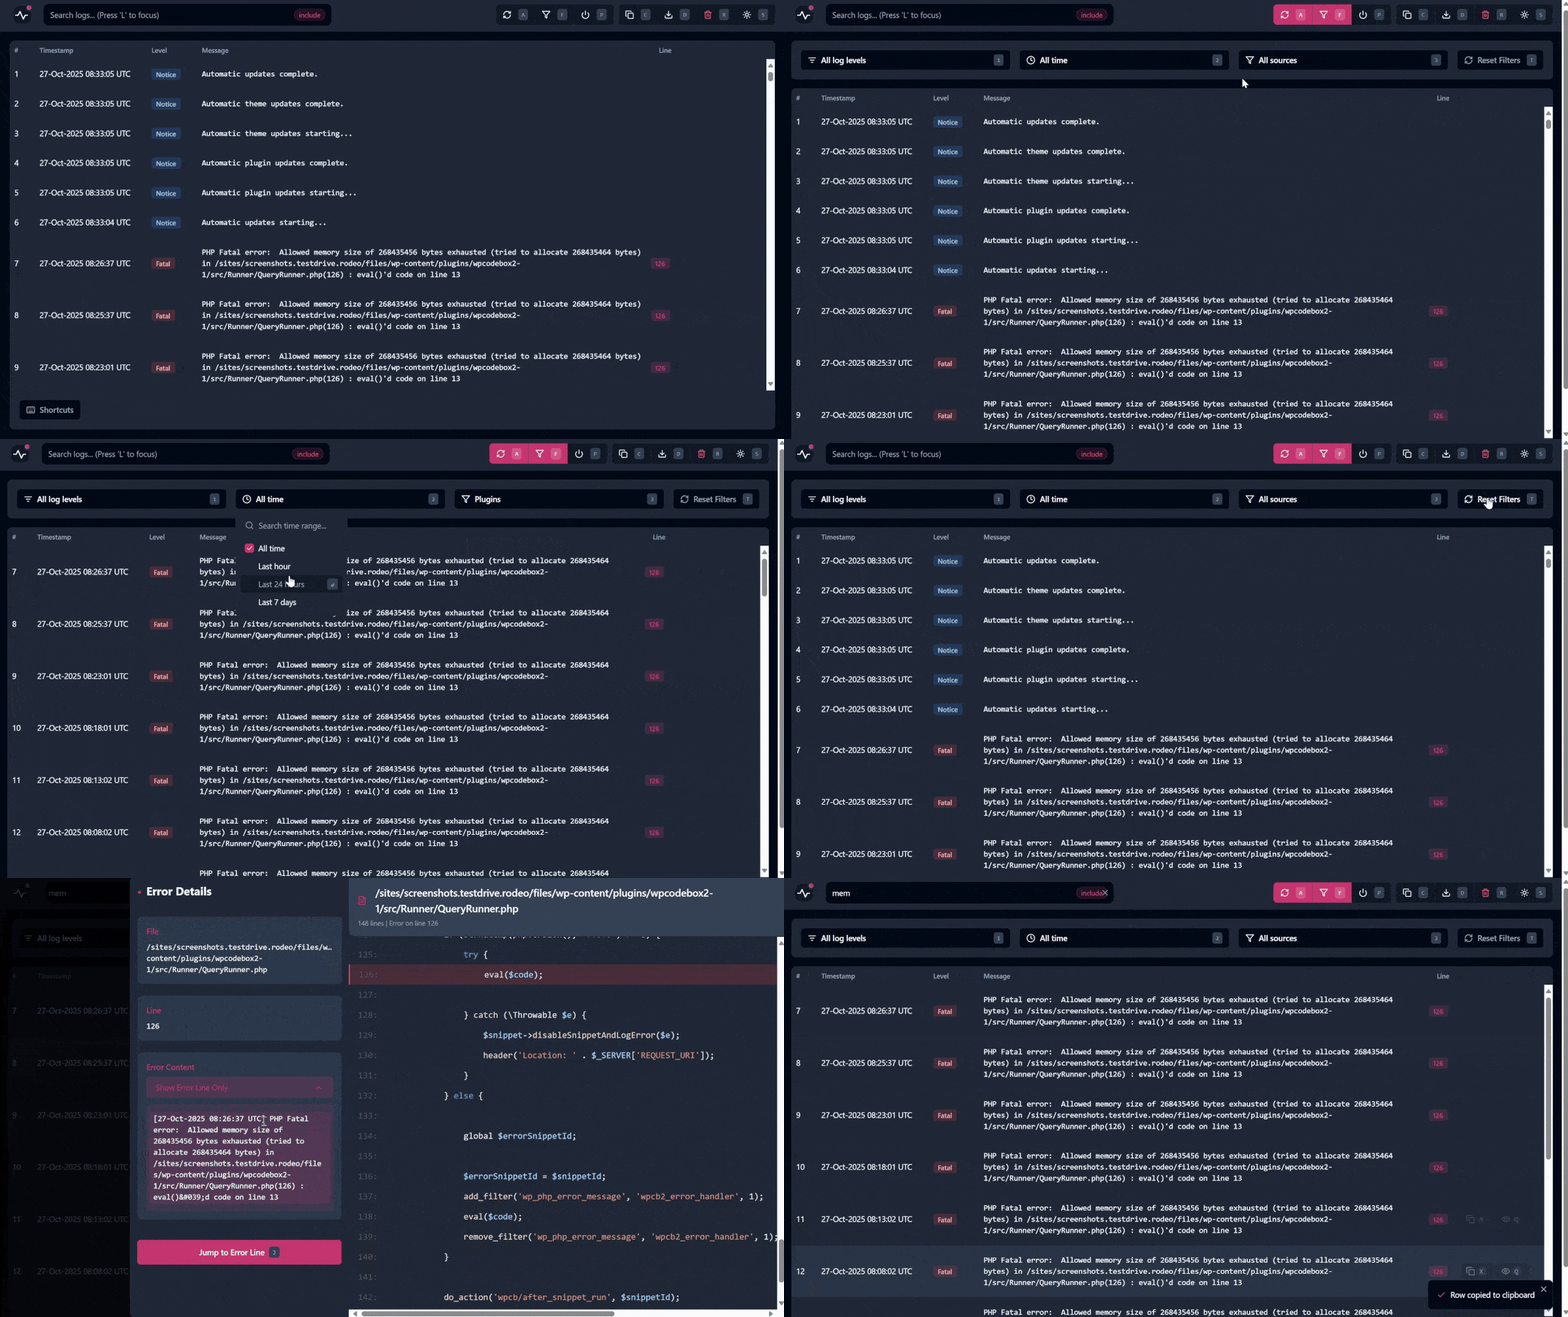
The plugin turns on debug mode with a single click from your dashboard. Once activated, it starts capturing every PHP error, warning, and notice in real-time.
Here's a quick look at WP Debug Toolkit in action:
Key Features
- Independent error log viewer app that functions even if WordPress crashes.
- Advanced filters to include or exclude logs by keyword, level, time, or source.
- Robust file viewer to examine full error context beyond just reading logs.
- Real-time error logging ensures you never miss critical issues.
- Crash recovery system helps regain access if site crashes or you get locked out.
- Keyboard shortcuts for seamless navigation within the log viewer app.
- Error highlighting makes it easy to quickly identify different error levels.
- Theme switcher ensures debugging remains smooth with your preferences.
Pros
- Modern & user-friendly interface.
- Easy error log access and reading capabilities.
- Simplified debug constants management from admin interface.
- Crash recovery system for site access restoration.
- Self-contained application works independently of WordPress.
- File viewer provides complete error context.
- Maintains error log accessibility during WordPress downtime.
Cons
- Premium plugin with no free version available
- Still need basic technical knowledge to understand error messages
2. Query Monitor
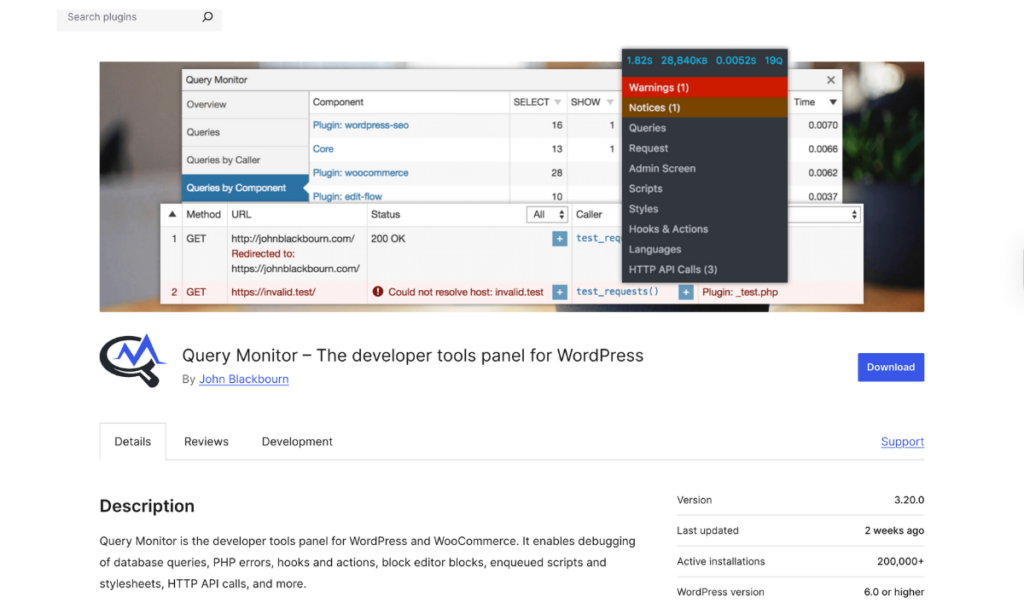
Query Monitor is one of the most popular WordPress debugging plugins, offering a comprehensive set of error monitoring and troubleshooting features that make it a strong choice for developers and technical users.
The plugin was designed to mimic Chrome Developer Tools, but for WordPress and WooCommerce. It provides detailed diagnostic information about your WordPress site, allowing you to identify and troubleshoot errors efficiently.
It adds a menu to your admin toolbar that provides a quick overview of the current page load. Clicking the menu opens a pop-up panel containing more detailed information, including sections for checking database queries, PHP errors, HTTP API calls, enqueued scripts, and more.
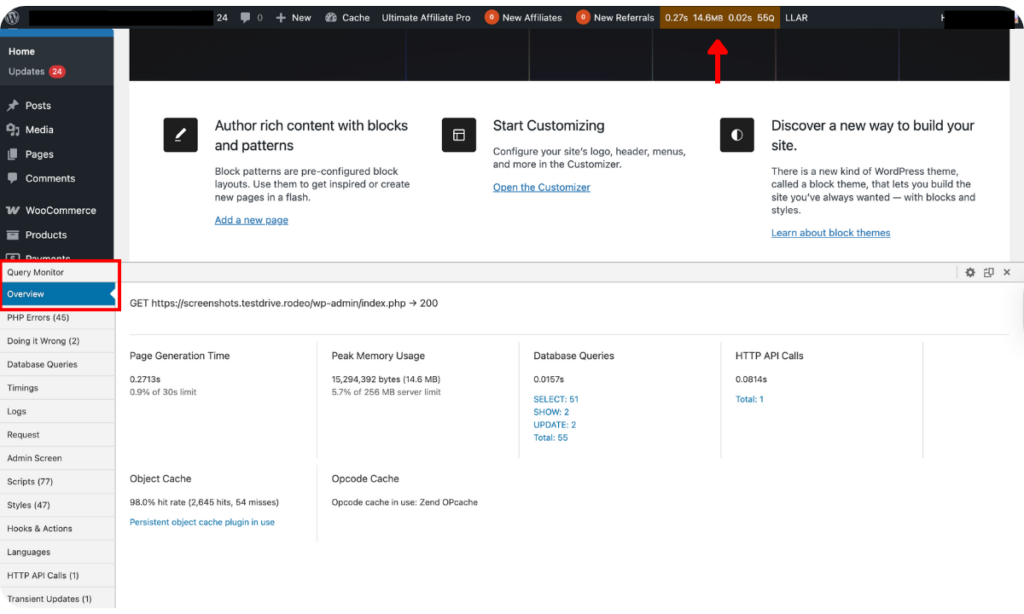
If you are adding custom code to your site, Query Monitor can flag any PHP errors in real-time, helping you identify and fix bugs immediately. The WordPress debug plugin also allows you to debug the value of PHP variables without using the var_dump function, making your coding workflow more convenient.
Key Features
- User-friendly interface that’s easy to navigate.
- Allows debugging of database queries sorted by time, calling function, and components.
- Supports debugging of PHP errors, enqueued scripts and stylesheets, hooks, actions, and more.
- Includes advanced features for tracking and debugging Ajax calls, REST API calls, and user capability checks.
- Enables grouping of data output by plugin or theme for easy identification of poor performers.
- Allows setting an authentication cookie to view output even when not logged in or logged in as a non-administrator.
Pros
- Powerful WordPress debugging capabilities
- Supports troubleshooting performance issues
- Offers real-time data insights
- Groups queries by source intuitively
- Easy-to-use navigation
- Regularly updated
- Free to download
Cons
- Lacks historical data
- May slightly impact site performance, especially on large sites
- Data-rich panels can feel overwhelming, especially for beginners
- Requires technical knowledge to decode data insights
- May conflict with some plugins, as reported by some users
3. Debug Log Manager
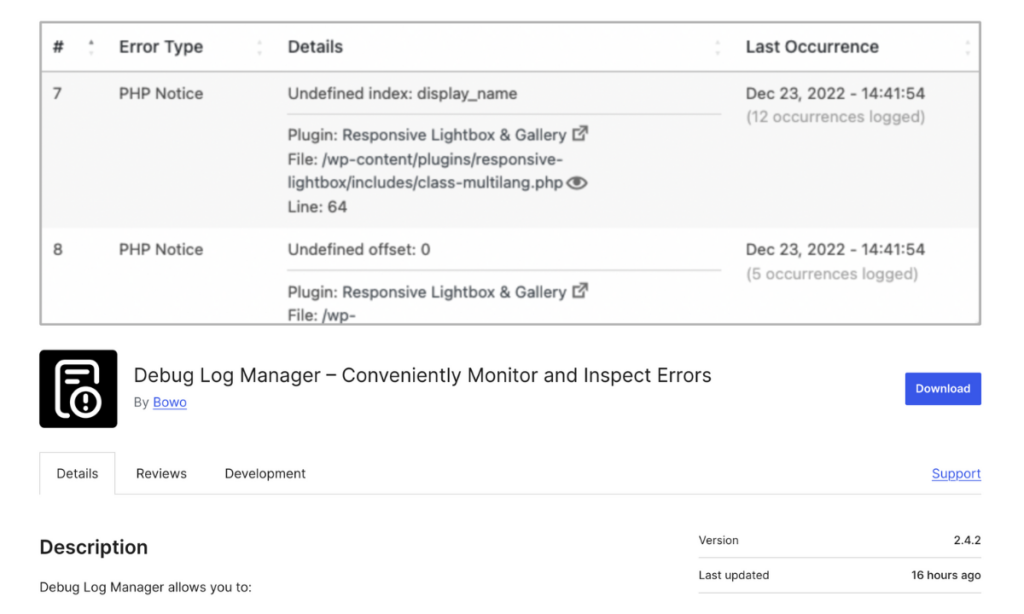
The Debug Log Manager plugin offers a simple and clean interface for identifying and troubleshooting WordPress errors. With just one click, you can activate WP_DEBUG and begin logging PHP, database, and JavaScript errors on your site.
Logged errors appear in a table sorted by error type, details, and the date and time they last occurred. The specifics of each error are broken down further by source (such as core, plugin, or theme), file path, and line number. This makes it easy to read and quickly trace the origin of an error.
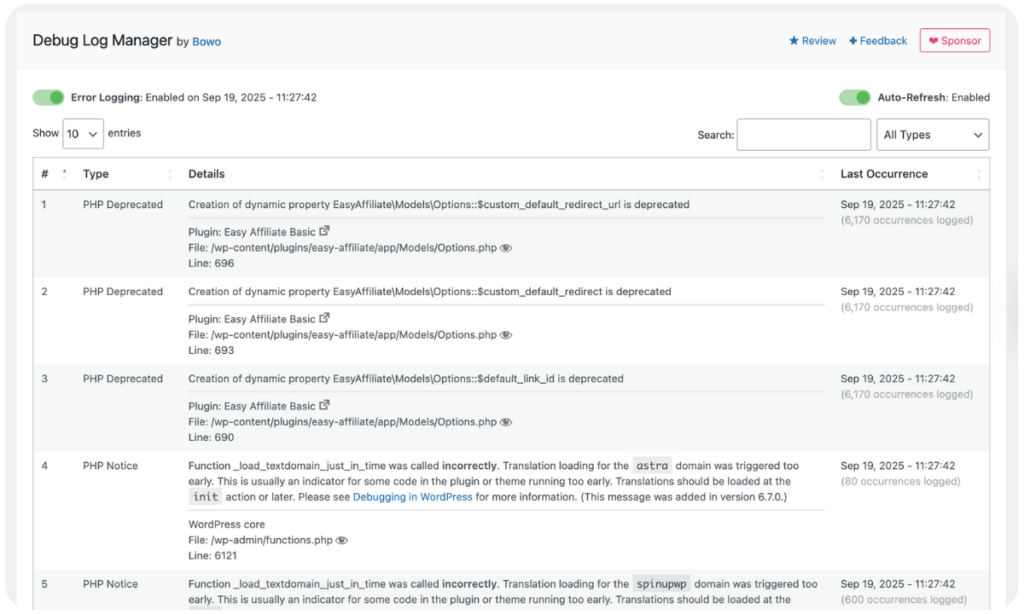
One notable feature of the Debug Log Manager plugin is that, instead of creating the debug.log file in the /wp-content/ folder, it stores it in a non-default location with a custom file name. This adds an extra layer of security by preventing easy access to the file.
Key Features
- Enables built-in WordPress error logging with a single click.
- Stores
debug.logfile in a non-default location for added security. - Includes a search bar and filters to quickly locate specific errors during WordPress debugging.
- Features auto-refresh to log new entries automatically without reloading the browser tab.
- Provides an error log clearing feature to delete old logs and save disk space.
- Adds a dashboard widget to show the latest logged errors at a glance.
- Shows an indicator on the admin toolbar when error logging is enabled, ensuring you never forget to disable it after debugging.
Pros
- Enable error logging with no code
- Decent set of WordPress debugging features
- Enhanced security for
debug.logfile - An indicator to prevent leaving error logging turned on indefinitely
- Free plugin
- Frequently updated
Cons
- Requires some technical knowledge
- Previous security bypass issues
4. WP Debugging
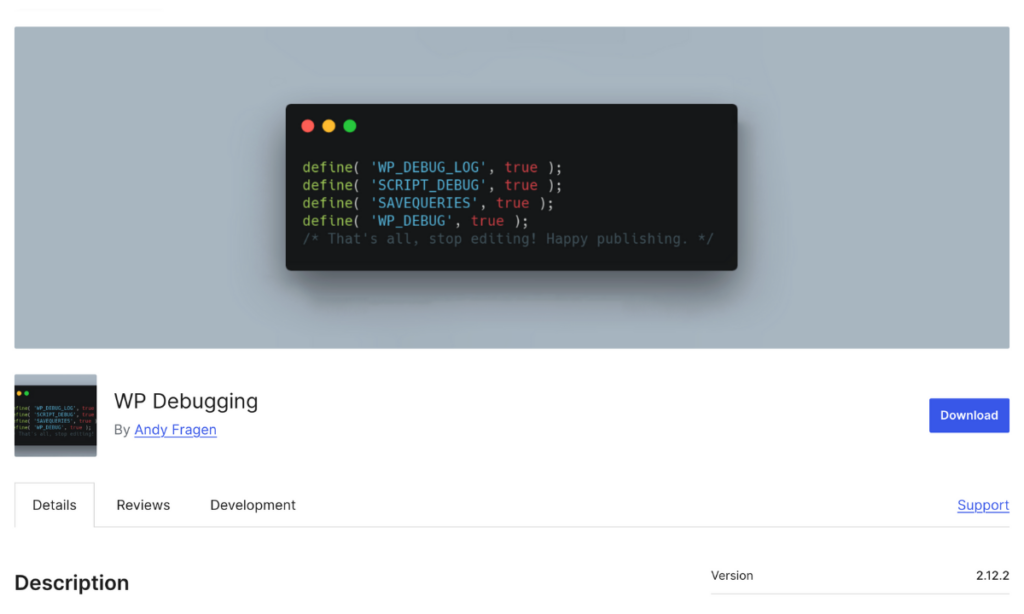
WP Debugging is another popular WordPress debugging plugin that is loved for its simplicity in enabling the built-in WordPress debug mode and error logging feature.
The plugin automatically adds three WordPress debug constants to the wp-config.php file when activated, allowing users to avoid manually editing the file.
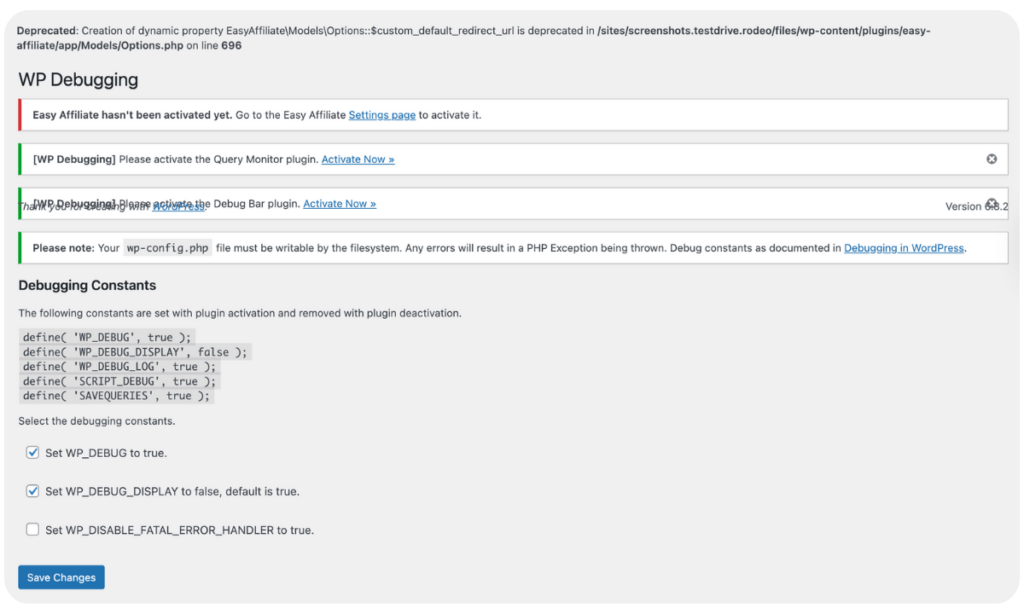
To enable WordPress debug mode and error logging, simply check the corresponding boxes, and they will be activated immediately. Debug mode is instantly turned off, and the constants are removed once you deactivate the plugin.
WP Debugging includes Debug Quick Look, which makes it easy to view errors logged in the debug.log file. It also offers optional integrations with the Query Monitor and Debug Bar plugins to enhance its WordPress debugging and troubleshooting features.
Key Features
- Simple and easy-to-use interface.
- Automatically adds built-in WordPress debug constants upon plugin activation.
- Includes Debug Quick Look to view logged error details.
- Optional integrations with Query Monitor and Debug Bar plugins for enhanced WordPress debugging.
- Automatically removes WordPress debug constants upon plugin deactivation.
Pros
- Free to download and use
- Easy to set up
- Straightforward user interface
- Eliminates the need to edit the
wp-config.phpfile with code - Includes a plugin to view
debug.logfile content - Integrates with Query Monitor and Debug Bar for extended functionality
Cons
- Limited WordPress debugging capabilities
- Depends on third-party plugins for additional features
- Error log display issues
- Not frequently updated
5. Debug Bar
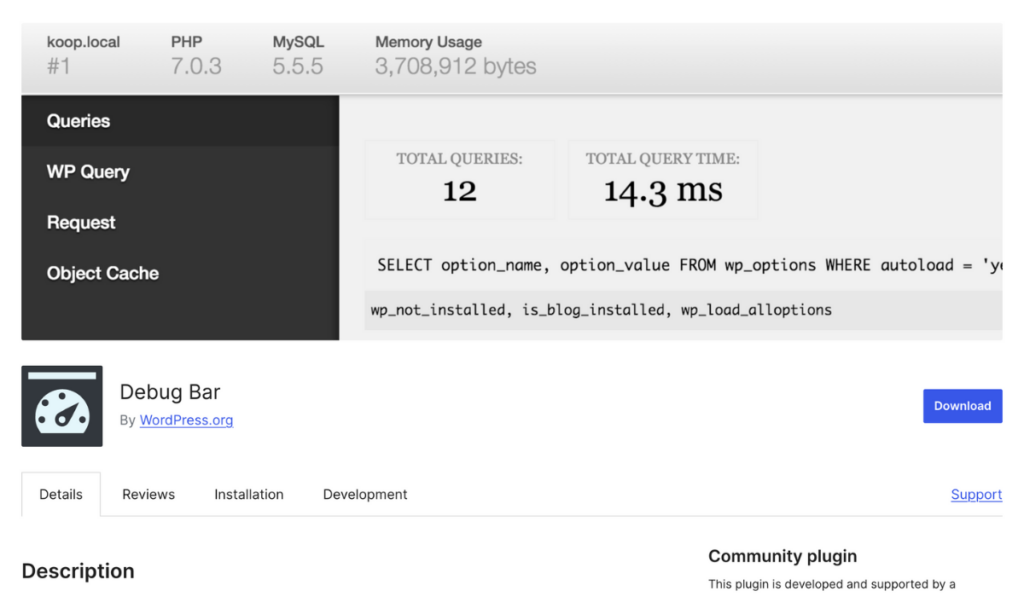
Debug Bar is a popular debugging plugin that adds a clean debug menu to the WordPress admin toolbar, allowing users to view useful debugging information, such as queries and cache.
Unlike most other WordPress debug plugins that include features to enable the built-in WordPress debug mode from the admin dashboard, Debug Bar requires you to enable it in the wp-config.php file manually. Once this is done, you can also monitor PHP warnings and notices from the plugin’s interface.
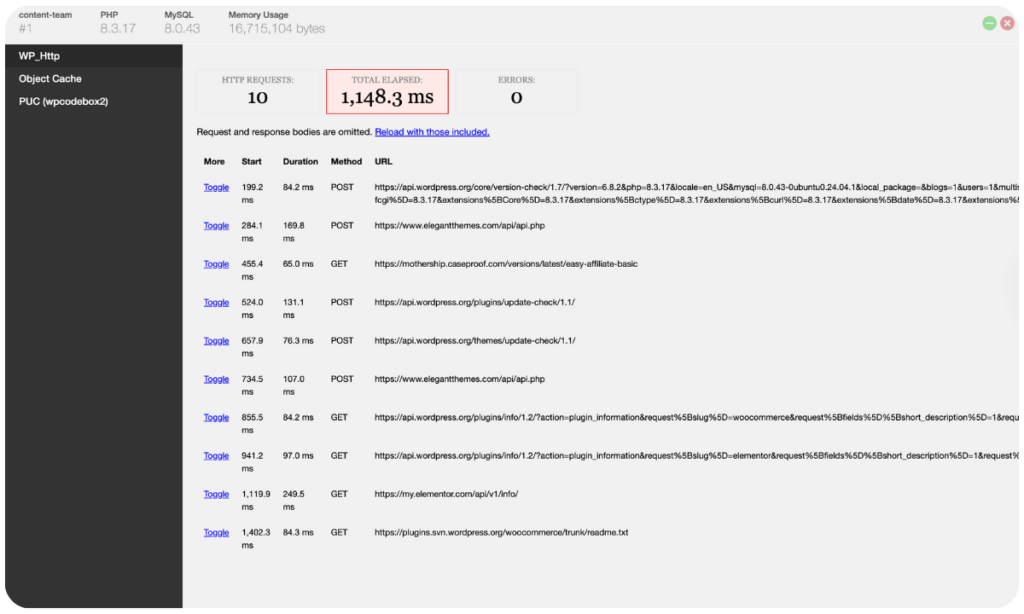
To further expand its features and provide more WordPress debugging insights, Debug Bar offers a variety of add-ons. These include add-ons for WP Cron, Post Types, Shortcodes, Actions, and Filters.
Key Features
- Displays debugging information for queries and cache by default.
- Tracks and displays PHP warnings and notices when debug mode is enabled in the
wp-config.phpfile. - Tracks and displays all SQL queries when SAVEQUERIES is enabled in the
wp-config.phpfile. - Provides numerous add-ons to extend its capabilities.
Pro
- Quickly troubleshoot query and cache issues
- Add-ons to extend features
- Free to use
Cons
- Requires code to enable specific options
- Can feel overwhelming for non-technical users
- Limited WordPress debug information displayed out of the box
- Limited plugin updates (last update was 2 months ago as of 09/18/2025)
6. Debug This
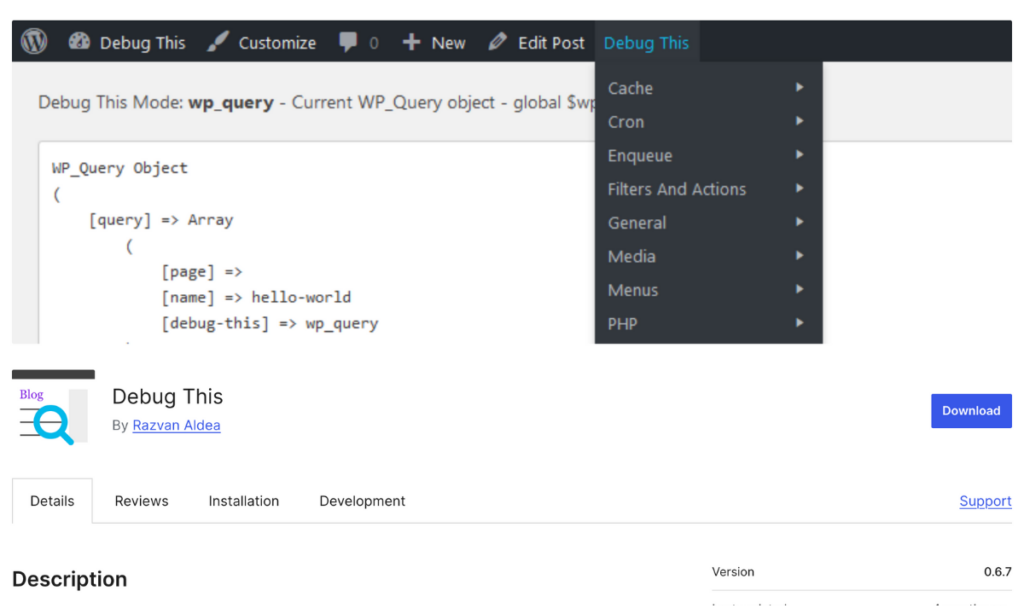
Debug This is a more technically advanced WordPress debug plugin designed specifically for WordPress site administrators, developers, and support staff.
It helps save time by providing access to a wide range of information about a WordPress site, including; the current WP_Query object, embed providers, files in rendered HTML (CSS, images, JavaScript), filters and actions, globals and constants, rewrite rules, queries, PHP and server information, WP cron schedules and jobs, WP debug log, and much more.
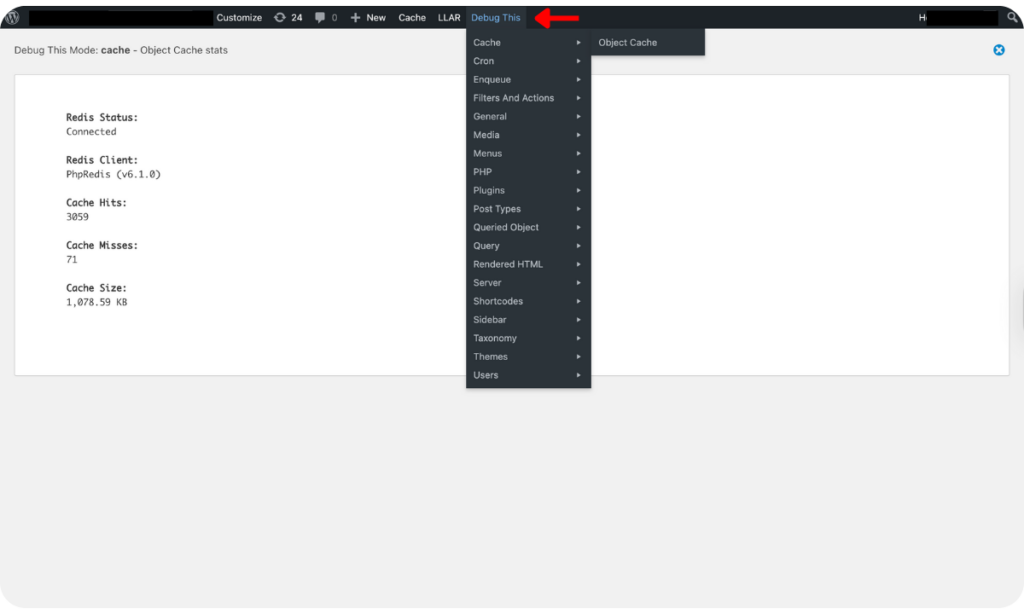
With the Debug This plugin, instead of hard-coding WordPress debug snippets or writing complex unit tests for small functionalities, you can easily access what you need directly from the admin bar.
The setup process is simple. After installing the plugin, you can access it via your admin toolbar. From the drop-down menu, you can then select the information you want to view for troubleshooting purposes.
Key Features
- Provides information on filters and actions, scripts and styles enqueued, PHP errors, object cache stats, and many more.
- Supports creating new WordPress debug modes with code.
- Supports extending the plugin with code snippets for your own needs.
- Shows all SQL queries when SAVEQUERIES is on, making it easy to identify performance issues.
Pros
- Easy access via the admin toolbar
- Extensive information provided
- Speeds up WordPress debugging process
- Free to use
Cons
- Too technical for beginners
- Few filtering and grouping capabilities
- Not updated frequently (last plugin update was 4 months ago as of 09/16/2025)
7. Black Bar
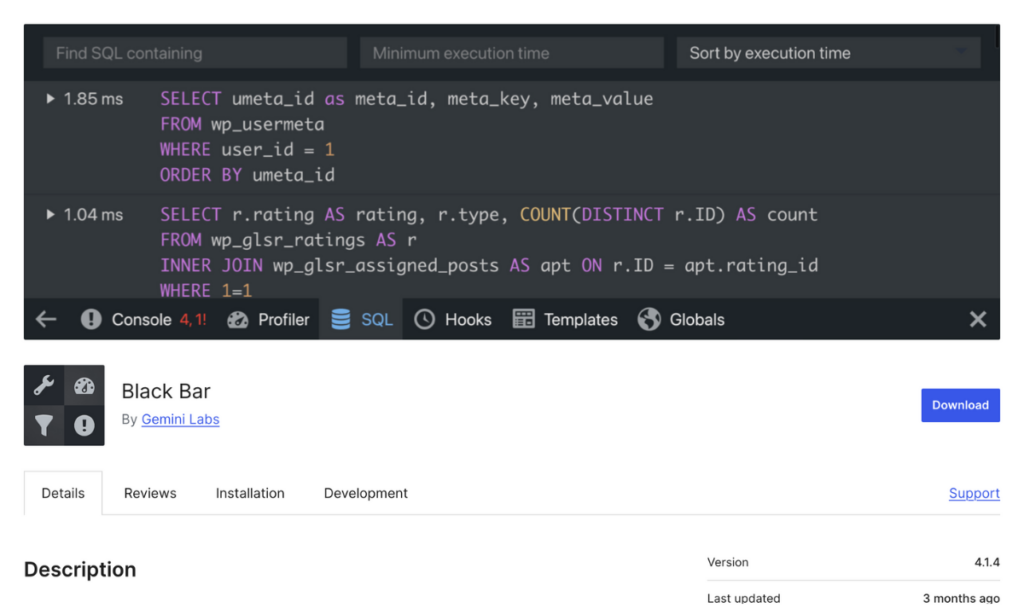
With the Black Bar plugin, you get a discreet debug bar that attaches itself to the bottom of your WordPress admin dashboard. The plugin makes WordPress development easier by collecting and displaying errors, executed SQL queries, slow actions and hooks, theme templates, and global variables.
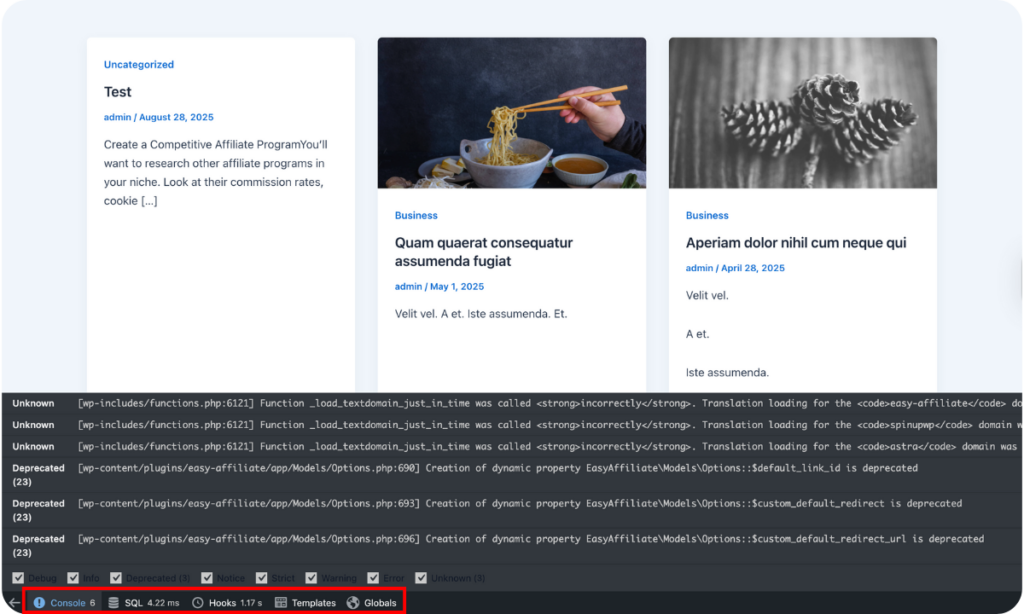
A profiler is also included that measures the resource consumption and execution time of your plugins, themes, and core WordPress functions to analyze your site’s performance.
- Key Features
- Supports debugging code with the Console.
- Enables viewing PHP errors, executed MySQL queries, and template files of the active theme, etc.
- Supports inspecting global variables such as COOKIE, GET, SERVER, SESSION, etc.
- Provides a profiler to help measure the performance of your code.
- Enables viewing the 50 slowest actions and filter hooks, in addition to callbacks ordered by priority.
Pros
- Clean, minimalist interface
- Ideal for profiling and identifying errors quickly
- Free plugin
Cons
- Limited WordPress debugging features
- Using the profiler and adding entries to the console requires code
- Not often updated (last plugin update was 3 months ago, as of 09/16/2025)
Best WordPress Debug Plugins — Conclusion
WordPress debug plugins are valuable tools that save you time when you need to identify and fix issues on your site. They help ensure your sites run at peak performance and stay healthy.
However, they all have different capabilities and limitations. Therefore, selecting the right one for your WordPress site depends largely on your debugging needs and technical skills.
For most WordPress users, WP Debug Toolkit offers the best balance of ease-of-use and powerful features. Its independent log viewer app ensures you can always access error logs, even during site crashes, while the modern interface makes debugging straightforward for users of all skill levels.
If you're a developer looking for comprehensive diagnostic tools and don't mind a steeper learning curve, Query Monitor is another excellent choice for advanced debugging capabilities.
WordPress Debug Plugins — Frequently Asked Questions
1. What is the best plugin for debugging WordPress?
WP Debug Toolkit stands out as the top WordPress debugging plugin for most users because it offers an easy-to-use interface with powerful features like an independent log viewer app and crash recovery system. Query Monitor is excellent for developers who need comprehensive diagnostic tools.
2. How to access WordPress debug?
To access WordPress debug, you need to enable the built-in WordPress debug mode feature. You can do this either by adding define(‘WP_DEBUG’, true); to your site’s wp-config.php file or by using a WordPress debug plugin.
3. How to enable WP_DEBUG and WP_DEBUG_LOG?
The easiest way is to use WP Debug Toolkit. You just install the plugin and enable debug mode with a single click from your dashboard. To do it manually, you need to access your wp-config.php file and add: define('WP_DEBUG', true); and define('WP_DEBUG_LOG', true);. This activates WordPress debug mode but requires code editing.
4. How to debug a plugin in WordPress?
To debug a plugin in WordPress, first enable WordPress debug mode and error logging. Then review the insights from the debug.log file to identify which plugin on your site is causing the problem, so you can find a solution for the issue.
5. How to use WP_DEBUG?
WP_DEBUG is used to enable WordPress’s built-in debug mode, making troubleshooting issues easier. To use it, you need to locate the wp-config.php file within your site’s file manager and find the code define( 'WP_DEBUG', false );. Next, change its value to true and also add define ('WP_DEBUG_LOG', true); and define('WP_DEBUG_DISPLAY', false); to prevent errors from being displayed directly on your site.
6. What are the risks of debug mode?
Enabling debug mode on your WordPress site and leaving it on indefinitely can be risky if you don't take proper precautions. Risks include exposing sensitive information like server details, allowing unauthorized access and remote code execution, enabling malware installation, and slowing down your site. To prevent these issues, only enable WordPress debug mode when needed and remember to turn it off after troubleshooting.
7. Where is the WordPress debug log stored?
The WordPress debug log is stored in the debug.log file, located within the /wp-content/ folder of your WordPress site's files.
