A random error that slows down or completely crashes your site is every WordPress user’s nightmare.
And when you can’t figure out the cause of the error easily, it can be rather frustrating. Your site’s performance, user experience, functionality, and even SEO ranking all tank if the error stays unresolved.
This guide will show you how to find and view WordPress error logs so you can quickly troubleshoot and fix those annoying errors when they appear.
Table of Contents
- Why Are WordPress Error Logs Important?
- How To Find and View WordPress Error Logs (2 Methods)
- Method 1: Using WP Debug Toolkit Plugin (Recommended)
- Method 1: Using Code to Enable WordPress Error Logs
- Wrap-Up: Easily Find and View WordPress Error Logs
Why Are WordPress Error Logs Important?
A WordPress error log is a text file that records all the errors happening behind the scenes on your website. It includes details such as the error message, timestamps for when the error occurred, the line of code where the error happened, and the full path of the file containing the error.
WordPress error logs make troubleshooting your website much easier. It doesn’t matter whether it’s an issue with your theme, plugin incompatibility, or custom code conflicts; everything is captured in the log. They’re especially helpful when you get locked out of your site or see the white screen of death, and you have no clue what may have caused the error.
By accessing the WordPress error logs, you can view all the details about the errors on your site, quickly identify the cause of the problem, and make an informed fix.
So, how do you find and view your WordPress error logs? Let’s take a look at the available options so you can choose the best one for you!
How To Find and View WordPress Error Logs (2 Methods)
By default, your WordPress site does not store error logs. While this feature exists, it is disabled to optimize your server's resource usage and minimize security risks associated with sensitive information being exposed. As a result, the information you need to troubleshoot an error on your site is not always readily available.
However, when you need to, you do have options for finding and viewing WordPress error logs. There are two main ways to do so, and we'll start with the easiest plugin-based approach first, then cover the manual method for those who prefer it.
Method 1: Using WP Debug Toolkit Plugin (Recommended)
If you want to avoid the complexities and risks that come with editing code, using a WordPress error log plugin is your best bet.
WP Debug Toolkit is the most user-friendly option for finding and viewing WordPress error logs. It lets you enable debug mode with a single click and provides a modern interface that makes debugging simple for users at all skill levels.
Let’s take a closer look at some of the features that this WordPress error logging plugin offers and see how to set it up and use it for easier debugging.
Why WP Debug Toolkit Makes Error Debugging Simple
WP Debug Toolkit is a modern WordPress error log viewer plugin that streamlines the debugging process.
It provides a sleek and user-friendly interface that lets you view all PHP and WordPress errors in real-time, without requiring SSH or FTP access.
One of its key features is the standalone Viewer App that allows you to keep track of errors on your WordPress site, even if it crashes entirely or you are locked out of your admin dashboard.
Other exciting features you get with the plugin include:
- Flexible filters that make it easy to search through logs and find precisely what you’re looking for.
- Error highlighting that makes identifying errors easier, so you can fix bugs faster.
- Keyboard shortcuts to navigate the app seamlessly if you’d rather not have to click so much while debugging.
- Integrated file viewer that lets you see the full context of an error, i.e., the exact file where the error occurred, what called it, etc.
- A crash recovery system that allows you to quickly disable all plugins and themes in a single click to recover your site when it crashes, and more.
How To Set Up and Use WP Debug Toolkit
Setting up and using WP Debug Toolkit is easy and safe. Here’s how to do it:
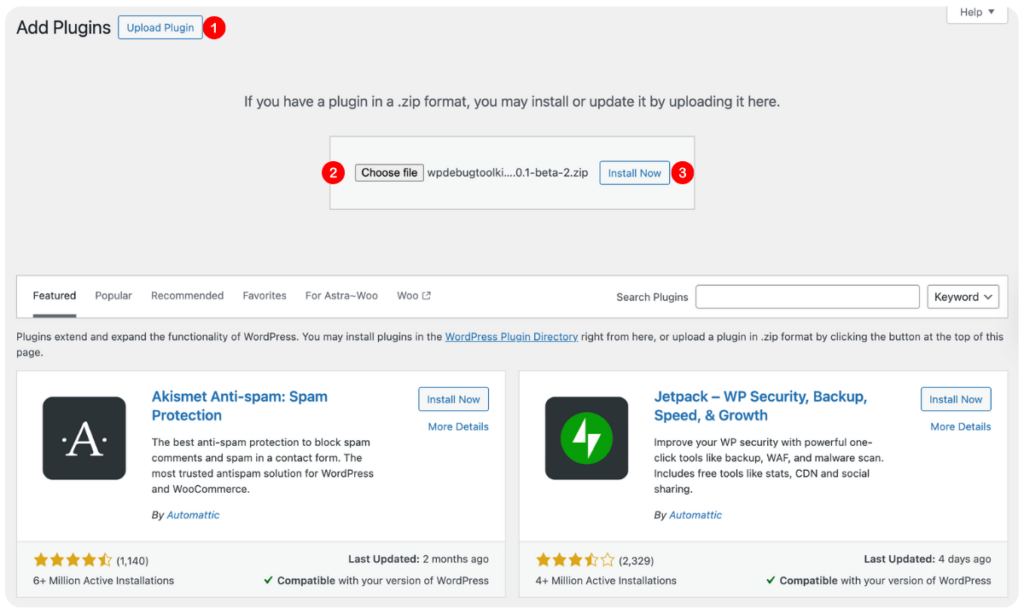
- Install and activate the WP Debug Toolkit plugin: First, you’d need to purchase and download the plugin file. Then, in your WordPress dashboard, go to Plugins › Add Plugin › Upload Plugin › Choose file › Install Now › Activate Plugin. The plugin will immediately be activated on your site.
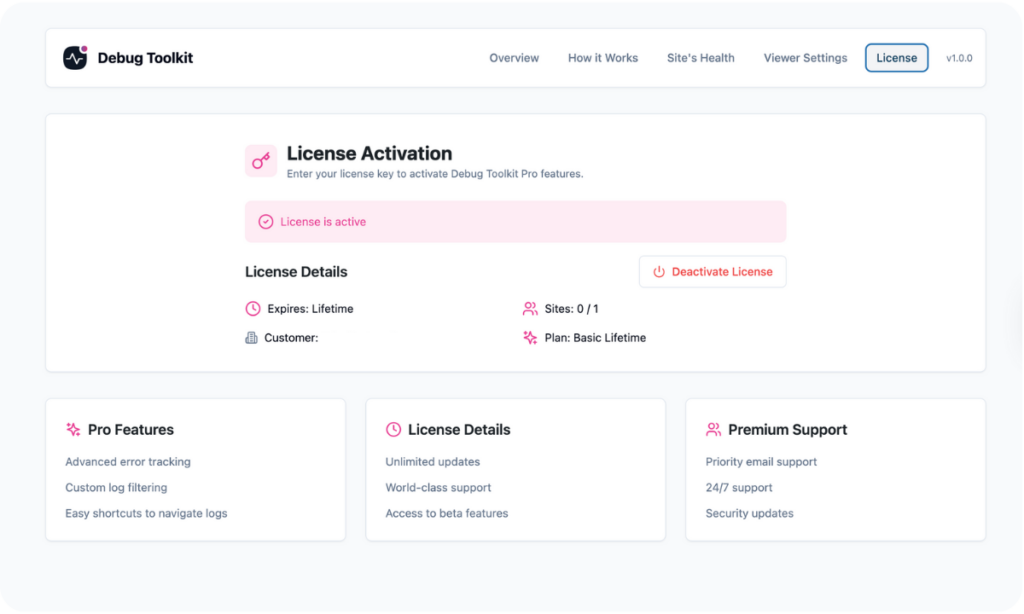
- Navigate to Debug Toolkit to set up your debugging environment: From the WordPress admin menu, select Debug Toolkit to open the setup page. First, activate your installation by clicking License on the menu and entering your license key.
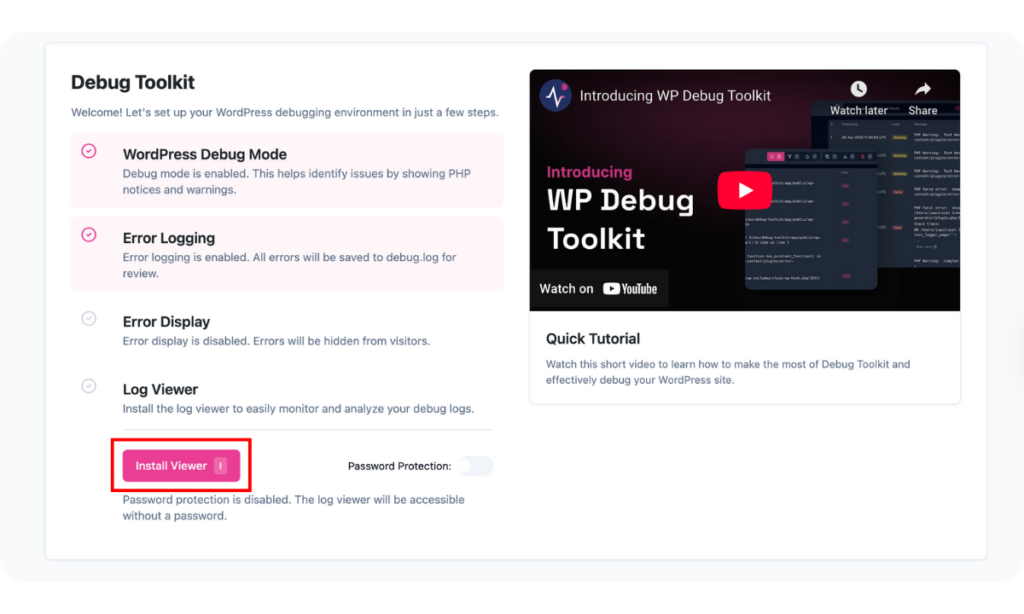
- Next, go back to the Overview page to complete the setup of your debugging environment. WordPress Debug Mode and Error Logging should be enabled. Afterward, click Install Viewer to install the Log Viewer.
- Once the installation completes, click Open Viewer (or press O on your keyboard). This opens a user and developer-friendly viewer app that displays your WordPress error logs.
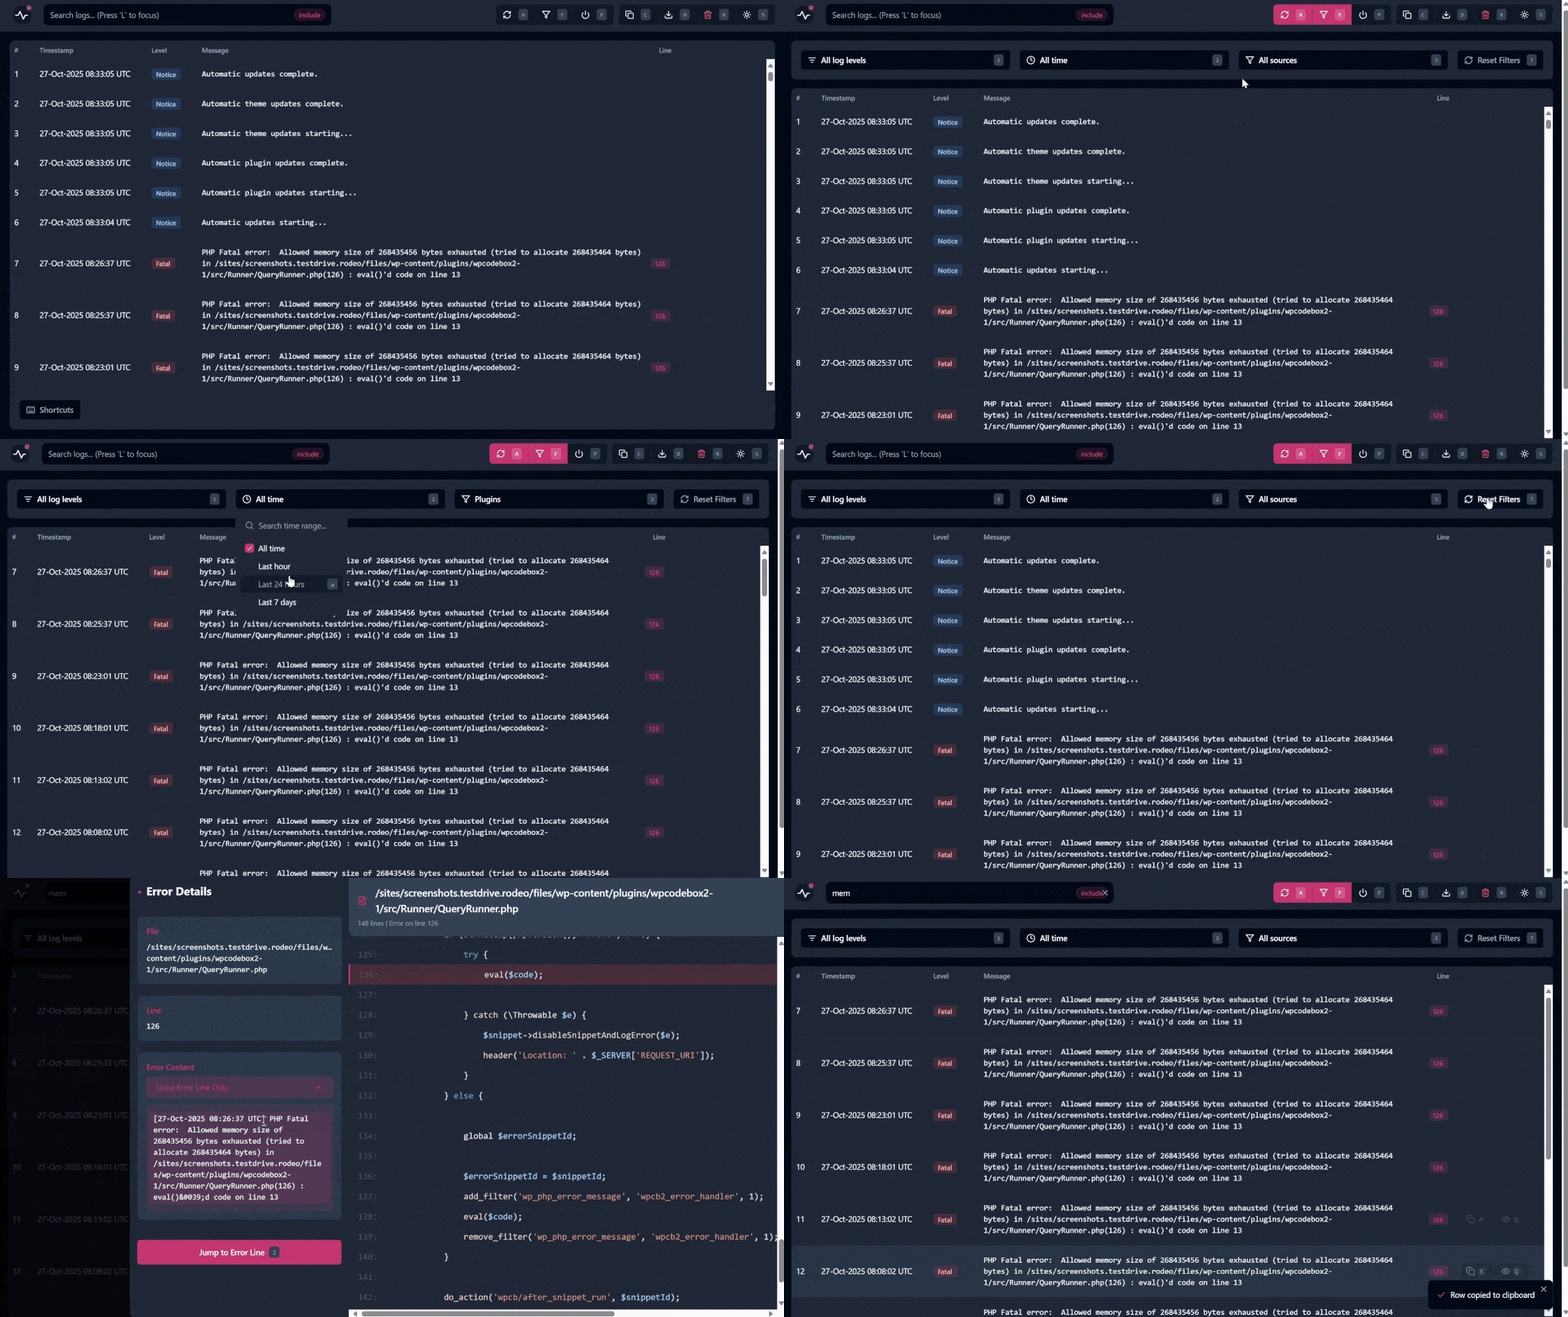
- From the app, you can view details about each error, search for specific strings across all log entries, filter the logs by error level, time period, or source, download the logs, access the crash recovery feature, and more!
Method 2: Using Code To Enable WordPress Error Logs in wp-config.php and Downloading the Files via FTP
If you're comfortable with code and prefer not to use a plugin, you can manually enable debug mode using the method below. However, this approach requires editing WordPress core files and accessing files via FTP.
That said, to enable and view WordPress error logs using this method, you will need to follow two steps:
Step 1: Enable Debugging Mode and Error Logging in wp-config.php
To enable debugging mode and WordPress error logging, you can directly edit your site’s wp-config.php file from the control panel provided by your hosting service provider. Alternatively, you can access the file using an FTP client, such as FileZilla or Cyberduck.
The wp-config.php file can be found in your site’s root directory (/public_html/).
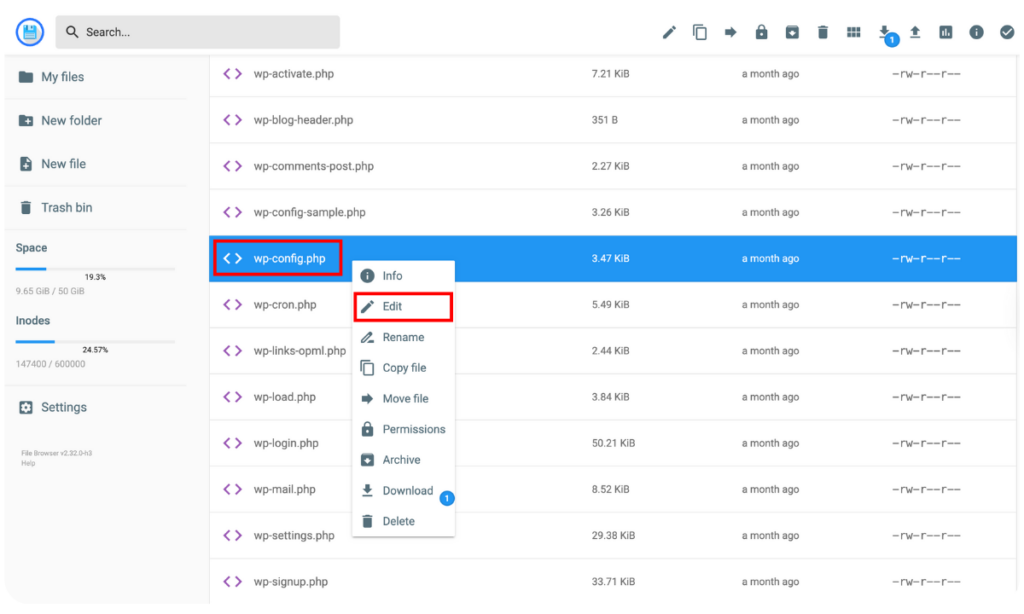
If you’re making changes from your cPanel, right-click on the file and then click Edit to reveal the built-in text editor.
First, search for “WP_DEBUG” in the code. You can easily find it by pressing the CTRL + F (PC) or CMD + F (Mac) shortcut keys.
If it exists, simply change its assigned value from “false” to “true” to enable WordPress debug mode.
If, however, the search doesn’t return any results, look for the line that reads /* That's all, stop editing! Happy publishing. */.
Right above it, paste the following code:
define( 'WP_DEBUG', true );
define( 'WP_DEBUG_LOG', true );
define( 'WP_DEBUG_DISPLAY', false );
This immediately enables WordPress debug mode, allowing error logs to be generated.
The “WP_DEBUG_DISPLAY” code is included to prevent WordPress from displaying error descriptions to your site visitors. Its value should ideally always be “false”.
Once you’ve made the edits, hit the save icon to proceed.
Step 2: Access and View WordPress Error Log Files via FTP
With debug mode enabled, you now need to reproduce the issue on your site so that WordPress error logs can be generated. Without doing this, your log file will be empty with no information to work with.
So, for example, if a specific plugin is causing issues on your website, you simply need to reactivate it so that the error is logged.
Once data is added to the debug.log file, you can access and view it via FTP.
Connect your site using your preferred FTP client. Next, open /public_html/ › /wp-content/, and scroll down to find the debug.log file.
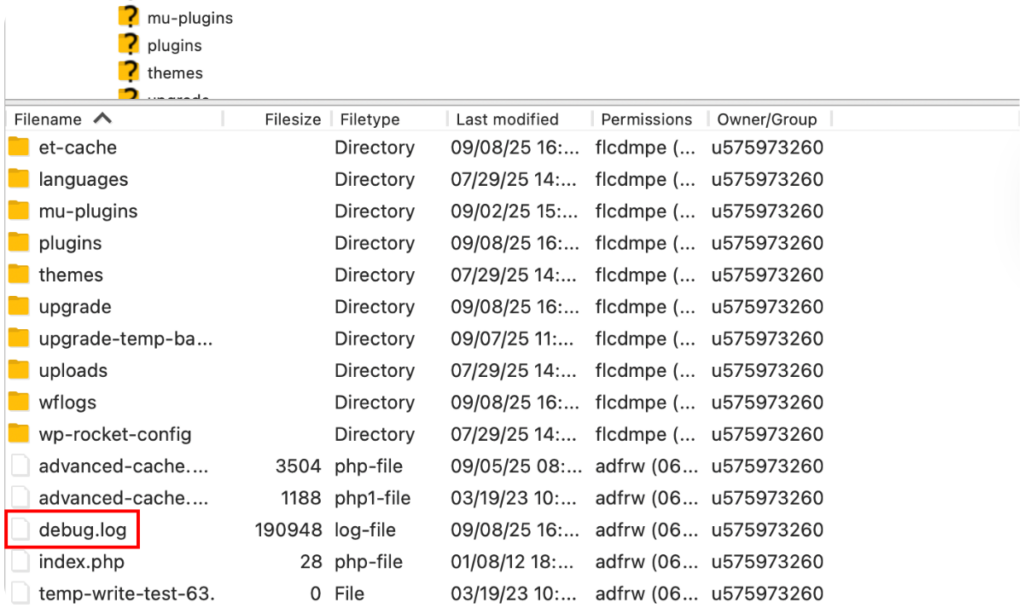
Right-click on the file to see options to download, view, or edit it. Choose the best option for your needs, and you should see details about all the errors logged on your site.
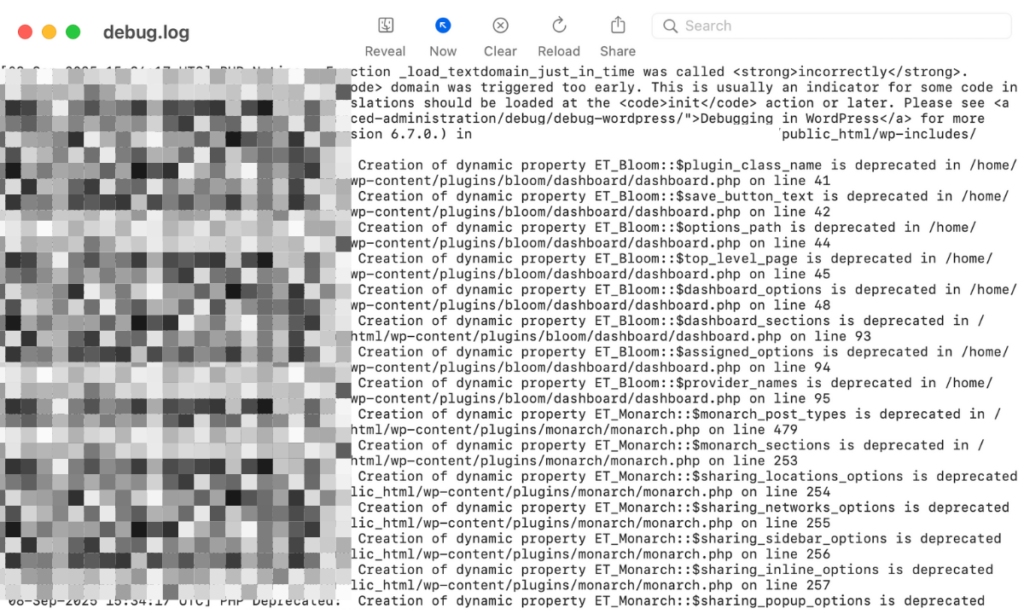
Using this information, you can now address the issues on your site with confidence.
Remember to turn off debug mode once you’ve resolved the errors. This is important so you don’t unintentionally slow down your site or compromise its security.
To disable it, just go back to the wp-config.php file and change the values for the code you added from “true” to “false”.
Wrap-Up: Easily Find and View WordPress Error Logs
Troubleshooting issues on your WordPress site is easy when you have the right tools to find and view error logs.
WP Debug Toolkit is the fastest and most user-friendly solution for most WordPress users. It eliminates the need for code editing and FTP access, letting you enable debug mode with one click and view errors through a clean, searchable interface. It comes with a built-in filtering feature, error-highlighting capabilities, an independent viewer app, a crash recovery system, and more, making it the better option for easily finding and viewing WordPress error logs.
The manual method of editing wp-config.php and accessing logs via FTP still works if you're comfortable with code and only need occasional debugging. However, it requires more technical steps and doesn't offer the advanced features that make WP Debug Toolkit so efficient.
WordPress Error Logs – Frequently Asked Questions
1. How do I see error logs in WordPress?
The easiest way is to use the WP Debug Toolkit plugin. You can install the plugin, activate debug mode with one click, and view all errors through the built-in log viewer. Alternatively, you can manually enable debug mode by adding code to your wp-config.php file and accessing the debug.log file via FTP.
2. How to debug a WordPress error?
You can debug a WordPress error with the WP Debug Toolkit plugin. Once you have installed and activated the WordPress error logging plugin on your website, simply install and open the Log Viewer app. You will see a list of all your WordPress error logs, with tools to search or filter through the code to quickly locate and fix any specific error.
3. How to check fatal error in WordPress?
A convenient way to check for fatal errors in WordPress is by using the WP Debug Toolkit plugin. Its user-friendly log viewer enables you to filter errors by levels, such as Notice, Warning, Fatal, Parse, and Error. This makes finding fatal errors on your site quick and easy.
4. How do I clear error logs in WordPress?
WordPress Debug Toolkit simplifies clearing WordPress error logs. After installing and activating the plugin on your site, go to Debug Toolkit › Open Viewer to access the log viewer interface. In the top right corner, you'll find the option to Clear Logs. Click it to delete your site’s error logs.
